One of the most useful and popular commands used on Cisco devices is the “show interface” command.
It can be very useful at troubleshooting connectivity issues and physical port issues, check the status of physical ports, watch how much traffic is passing through the interface, which IP address is assigned to the interface (for Layer3 interfaces) etc.
This command works on both Cisco Switches and Cisco Routers and has the same functionality on both types of devices.
In this article we will discuss and explain the “show interface” command on both routers and switches, so let’s get started.
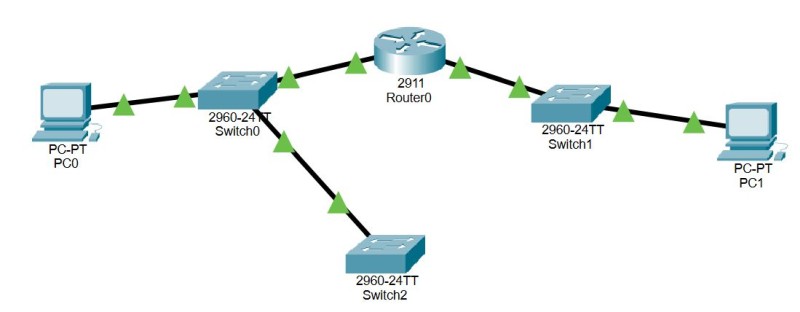
Topology Diagram
Here is the topology used to gather the various output data for each device in this article:
Show Interface on Cisco Switches
On a Layer 2 switch we can check the status and various other counters and metrics for each physical ethernet interface or for every interface on the device.
I usually start first with the following command:
Switch0# show interfaces status
Port Name Status Vlan Duplex Speed Type
Fa0/1 connected 1 auto auto 10/100BaseTX
Fa0/2 connected 1 auto auto 10/100BaseTX
Fa0/3 connected 1 auto auto 10/100BaseTX
Fa0/4 notconnect 1 auto auto 10/100BaseTX
Fa0/5 notconnect 1 auto auto 10/100BaseTX
Fa0/6 notconnect 1 auto auto 10/100BaseTX
Fa0/7 notconnect 1 auto auto 10/100BaseTX
Fa0/8 notconnect 1 auto auto 10/100BaseTX
The above gives me a quick status update of each available interface on the switch, on which VLAN it belongs, speed settings etc.
Now if you want to dive deeper in the counters for each physical interface, we can be more specific as shown below:
Switch0# show interfaces FastEthernet 0/1
FastEthernet0/1 is up, line protocol is up (connected)
Hardware is Lance, address is 000b.be66.0b01 (bia 000b.be66.0b01)
BW 100000 Kbit, DLY 1000 usec,
reliability 255/255, txload 1/255, rxload 1/255
Encapsulation ARPA, loopback not set
Keepalive set (10 sec)
Full-duplex, 100Mb/s
input flow-control is off, output flow-control is off
ARP type: ARPA, ARP Timeout 04:00:00
Last input 00:00:08, output 00:00:05, output hang never
Last clearing of “show interface” counters never
Input queue: 0/75/0/0 (size/max/drops/flushes); Total output drops: 0
Queueing strategy: fifo
Output queue :0/40 (size/max)
5 minute input rate 0 bits/sec, 0 packets/sec
5 minute output rate 0 bits/sec, 0 packets/sec
956 packets input, 193351 bytes, 0 no buffer
Received 956 broadcasts, 0 runts, 0 giants, 0 throttles
0 input errors, 0 CRC, 0 frame, 0 overrun, 0 ignored, 0 abort
0 watchdog, 0 multicast, 0 pause input
0 input packets with dribble condition detected
2357 packets output, 263570 bytes, 0 underruns
0 output errors, 0 collisions, 10 interface resets
0 babbles, 0 late collision, 0 deferred
0 lost carrier, 0 no carrier
0 output buffer failures, 0 output buffers swapped out
The “Show Interface” command above which includes the specific interface number (FastEthernet 0/1), shows much more information. The most important data you need to take into consideration are the following:
FastEthernet0/1 is up, line protocol is up (connected): This shows that the specific interface is connected (both physical access and line protocol are up), so it is ready to pass traffic.
Hardware is Lance, address is 000b.be66.0b01 (bia 000b.be66.0b01): Here you can see the MAC (hardware) address of the interface.
reliability 255/255: If you have reliability 255/255 it means that there are no input and output errors on the interface. If you have interface errors the reliability factor will decrease.
5 minute input rate 0 bits/sec, 0 packets/sec
5 minute output rate 0 bits/sec, 0 packets/sec
956 packets input, 193351 bytes, 0 no buffer
The above counters are useful to check how much traffic has passed through the interface the last 5 minutes.
2357 packets output, 263570 bytes, 0 underruns
0 output errors, 0 collisions, 10 interface resets
0 babbles, 0 late collision, 0 deferred
0 lost carrier, 0 no carrier
0 output buffer failures, 0 output buffers swapped out
The above counters are also useful to watch how much traffic has passed through the interface, if there were any errors or frame collisions, buffer failures etc.
NOTE: The number of errors shown on each interface is a cumulative number which shows statistics (input/output errors etc) from the time the device was booted up. If you see a small number of errors among millions of packets, then you don’t need to worry. However, if the total number of errors is a big percentage compared to the number of packets, then you should investigate for possible interface problems.
Let’s now see another useful show interface command on switches:
Switch0# show interfaces trunk
Port Mode Encapsulation Status Native vlan
Fa0/3 on 802.1q trunking 1
Port Vlans allowed on trunk
Fa0/3 1-1005
Port Vlans allowed and active in management domain
Fa0/3 1
Port Vlans in spanning tree forwarding state and not pruned
Fa0/3 none
If you want to see which interfaces are configured as “Trunk” ports, the above command will show you just this. As shown above, port Fa0/3 is configured as 802.1q Trunk which means it is connected to another switch in order to pass VLANs from one switch to another.
As you can see, VLANs 1-1005 are allowed to pass through the trunk connection.
Show Interface on Cisco Routers
On a Layer 3 router, the show interface command is equally important to obtain crucial information about each interface for various purposes.
Let’s see three cases of the command:
Router0# show ip interface brief
Interface IP-Address OK? Method Status Protocol
GigabitEthernet0/0 192.168.1.254 YES manual up up
GigabitEthernet0/1 192.168.2.254 YES manual up up
GigabitEthernet0/2 unassigned YES unset administratively down down
I always start by getting a brief high-level picture of all interfaces with the “show ip interface brief” command.
As shown above, this shows me the IP address assigned to each physical interface, if the port is UP, if the protocol is UP etc.
For example, one interface might be connected to a Frame Relay connection. The physical port might be UP but the protocol might show Down.
Now, if you want to get more IP details and other statistics for a specific interface, run the following:
Router0# show ip interface GigabitEthernet 0/0
GigabitEthernet0/0 is up, line protocol is up (connected)
Internet address is 192.168.1.254/24
Broadcast address is 255.255.255.255
Address determined by setup command
MTU is 1500 bytes
Helper address is not set
Directed broadcast forwarding is disabled
Outgoing access list is not set
Inbound access list is not set
Proxy ARP is enabled
Security level is default
Split horizon is enabled
ICMP redirects are always sent
ICMP unreachables are always sent
ICMP mask replies are never sent
IP fast switching is disabled
IP fast switching on the same interface is disabled
IP Flow switching is disabled
IP Fast switching turbo vector
IP multicast fast switching is disabled
IP multicast distributed fast switching is disabled
Router Discovery is disabled
IP output packet accounting is disabled
IP access violation accounting is disabled
TCP/IP header compression is disabled
RTP/IP header compression is disabled
Probe proxy name replies are disabled
Policy routing is disabled
Network address translation is disabled
BGP Policy Mapping is disabled
Input features: MCI Check
WCCP Redirect outbound is disabled
WCCP Redirect inbound is disabled
WCCP Redirect exclude is disabled
The command above shows statistics up to Layer 3 of the OSI model (Physical, Data Link and Network Layers). It shows the IP address configured and also if there are any Access Control Lists (ACL) applied to the specific interface with the below fields:
Outgoing access list is not set
Inbound access list is not set
An ACL is a packet filtering mechanism which controls IP packets passing through the interface (block or allow) based on IP address and port numbers.
Now let’s see the generic show command which we described also on the switch section above:
Router0# show interfaces GigabitEthernet 0/0
GigabitEthernet0/0 is up, line protocol is up (connected)
Hardware is CN Gigabit Ethernet, address is 00e0.f9d3.3d01 (bia 00e0.f9d3.3d01)
Internet address is 192.168.1.254/24
MTU 1500 bytes, BW 1000000 Kbit, DLY 100 usec,
reliability 255/255, txload 1/255, rxload 1/255
Encapsulation ARPA, loopback not set
Keepalive set (10 sec)
Full-duplex, 100Mb/s, media type is RJ45
output flow-control is unsupported, input flow-control is unsupported
ARP type: ARPA, ARP Timeout 04:00:00,
Last input 00:00:08, output 00:00:05, output hang never
Last clearing of “show interface” counters never
Input queue: 0/75/0 (size/max/drops); Total output drops: 0
Queueing strategy: fifo
Output queue :0/40 (size/max)
5 minute input rate 1017 bits/sec, 0 packets/sec
5 minute output rate 1017 bits/sec, 0 packets/sec
886 packets input, 113108 bytes, 0 no buffer
Received 0 broadcasts, 0 runts, 0 giants, 0 throttles
0 input errors, 0 CRC, 0 frame, 0 overrun, 0 ignored, 0 abort
0 watchdog, 1017 multicast, 0 pause input
0 input packets with dribble condition detected
886 packets output, 113108 bytes, 0 underruns
0 output errors, 0 collisions, 1 interface resets
0 unknown protocol drops
0 babbles, 0 late collision, 0 deferred
0 lost carrier, 0 no carrier
0 output buffer failures, 0 output buffers swapped out
Just like the command executed on a switch, the same command on a Cisco router displays similar statistics such as:
- Status of interface (up or down).
- Port reliability which depends on the number of input/output errors.
- 5 minute input and output traffic rate.
- Number of packets received .
- Errors on the interface
- And much more.
Related Posts
- How to Configure a Loopback Interface on Cisco Router & Switch
- The Most Important Cisco Show Commands You Must Know (Cheat Sheet)
- What is Cisco Switch Virtual Interface (SVI) – Configuration Example and Explanation
- Deleting the VLAN Database from a Cisco Switch (IOS or Nexus)
- What is Cisco Virtual Port Channel (vPC) – Explained and Discussed