Cacti is a popular open source networking tool that is web based, and it is used both for network monitoring and graphing.
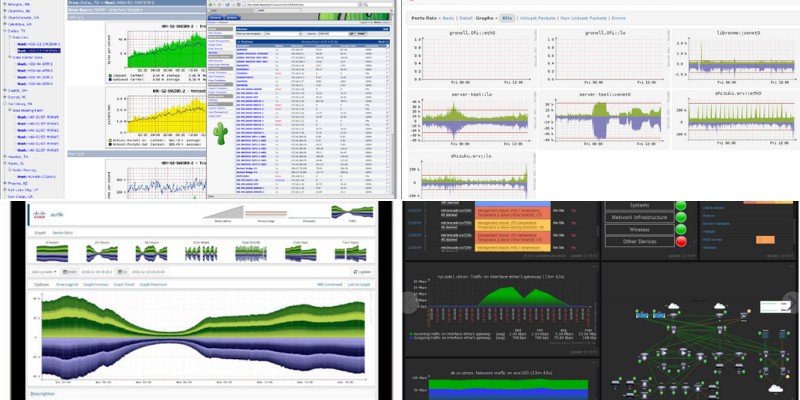
In my work environment we use Cacti extensively to mainly monitor bandwidth on interfaces of switches etc. It is a complex tool to learn but very powerful.
With Cacti you can poll services, interfaces, devices etc, and then you can graph the data collected from polling.
The interface is user friendly and intuitive, and it can be used on complex networks with many devices. However, it has a little bit of steep learning curve to set up correctly.
Cacti is free to use. However, there are several alternative software tools that you can use with many of them easier to set up and operate.
Take a look at the following 10 Cacti alternatives for network bandwidth monitoring. We present both free and paid options, so let’s get started.
Note that the list below is in no particular order.
1. ManageEngine Netflow Analyzer
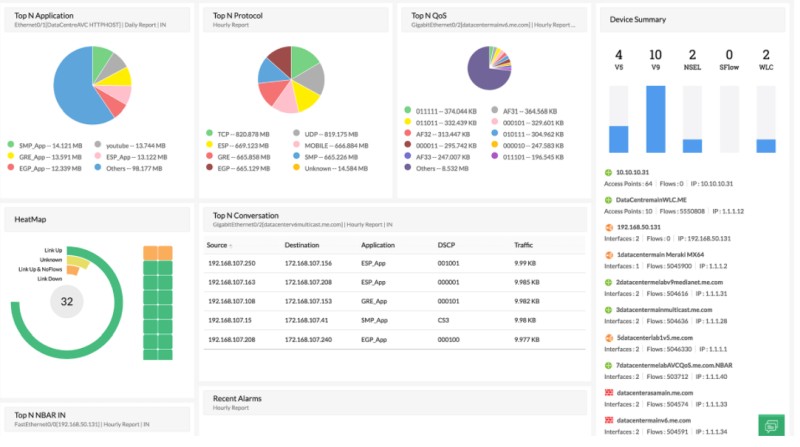
This software tool offers a combination of analysis and control in your monitoring. You get flow-based network traffic monitoring and in-depth traffic analysis.
It uses net-flow technologies (supports NetFlow, JFlow, sFlow, IPFIX etc) to give you real-time visibility into your network’s bandwidth performance.
It is a bandwidth monitoring tool that gives you also insight into your bandwidth and traffic patterns to identify the root cause of bandwidth choking, possible security issues, or even identify an ongoing DDoS attack in your network.
Netflow Analyzer is a unified solution, and it collects, analyzes, and reports who is using your bandwidth and what they are doing with it.
It can help you optimize your network by performing network forensics, network traffic analysis, and network flow monitoring.
Some of the other features include finding nonstandard apps that are hogging your bandwidth and capacity planning reports.
It has a free version and offers a free trial on the paid version. The cheapest paid version is the Professional Edition with a one time fee of $595. Here is the pricing page to get a personalized quote.
2. Nagios
Nagios is one of the well known software for IT management and monitoring purposes and offers complete bandwidth monitoring of switches, routers, IT devices etc using SNMP.
It has a switch or router monitoring wizard that makes it easy to set up, and you can find overused ports, discover network abusers, track bandwidth use and errors, and detect network outages and protocol failures quickly.
Nagios is free for small environments of up to seven nodes or hosts. There is a paid version for large systems, and it starts at $1995.
This is a one-time fee for the license to use the software, and the pricing is per user. They offer training through webinars, videos, and documentation.
This software allows you to monitor all mission critical infrastructure components on any operating system, and it allows you comprehensive monitoring.
3. PRTG
PRTG allows you to monitor your bandwidth and much more. It is also another popular monitoring tool just like Nagios above.
It will analyze your bandwidth, detect overloads, and it supports SNMP, WMI, Packet Sniffing, and Netflow.
It can help you find problems with large file transfers, which can use a lot of bandwidth. In addition, if users are complaining that programs are slow or customers find your website unresponsive, this software can help you find out where the problem is.
It also comes in handy when you find that your systems are malfunctioning during backups.
This software will look at all of the traffic data from your router or other networking devices, and it provides you with detailed statistics showing where your bandwidth is being overused.
It can show you graphs and how bandwidths are being used based on different parameters. You can also get custom alerts when your system is suffering an issue.
They offer a free version, and the unlimited version is free for 30 days. The paid versions start at $1750.
4. Zabbix
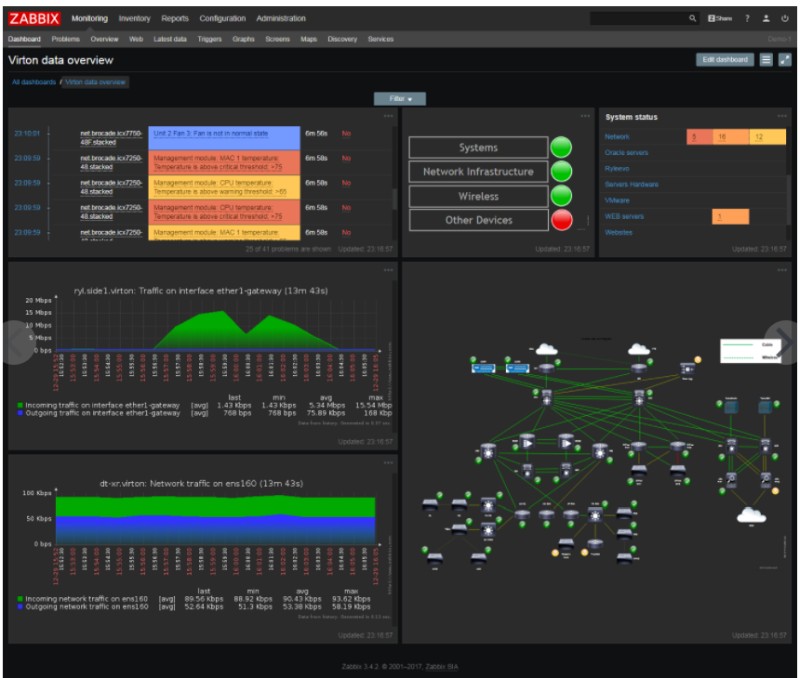
Zabbix allows you to monitor all of the performance metrics and incidents in your network. You can look at your network performance, including bandwidth usage, packet loss rate, high CPU or memory utilization, and more.
It also checks your network health. It tells you when a link is down, when device temperatures are too high or low, when your free disk space is low, and other critical measures.
In addition, it will let you know when there are configuration changes, such as a new device being added or taken away, firmware being upgraded, and other things.
It comes with out-of-the-box templates that let you monitor popular brands of devices, and it has flexible and extendable data gathering.
It can predict network downtimes and trends of bandwidth usage. It also sends notifications to you. You can also encrypt all of the traffic between Zabbix and your network devices.
It has no limits and no hidden restrictions. It is free open source software, but they request that you purchase some kind of support from them if you use it commercially.
5. Icinga 2
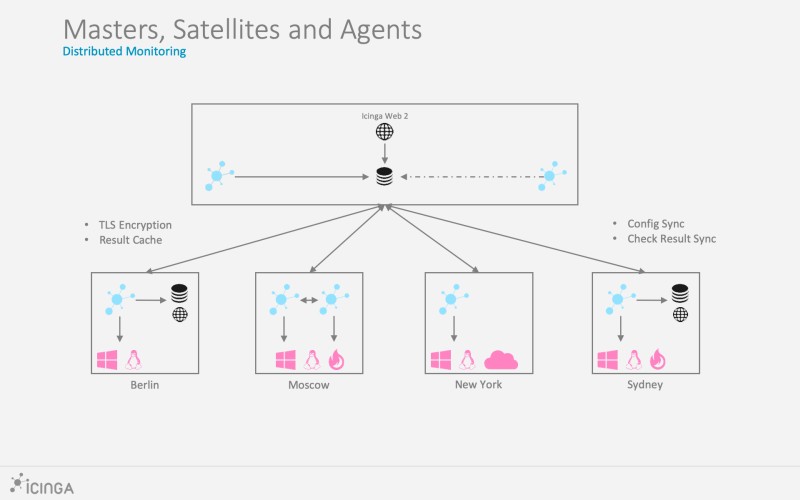
The monitoring system provided by Icinga 2 will let you know about outages, check on the availability of your network resources, and generate performance data for reporting.
This tool is scalable and extensible, and it is able to monitor large complex environments in different locations.
It is a powerful monitoring tool, and it has some great features. It is easy to install, and you can do basic monitoring with preconfigured templates or plugins.
You can tell it which services to check on different servers, and you can use a ping command to make sure that any of the servers are on and responding.
There are plugins available for different hosts and services. Icinga 2 is open source and free to use.
6. LibreNMS
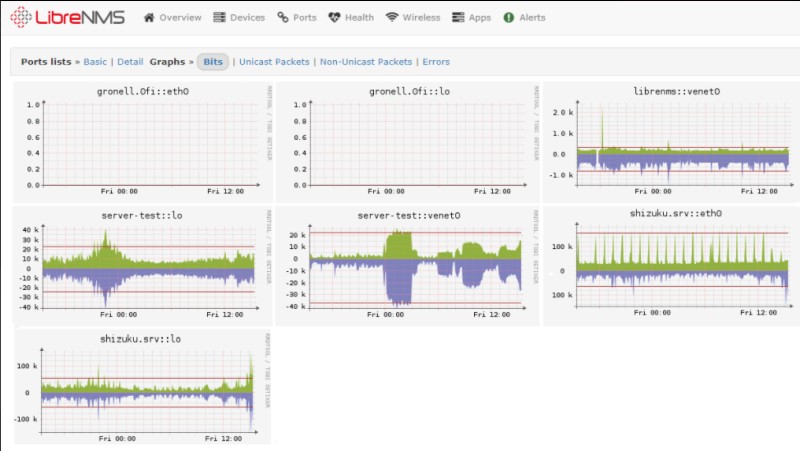
LibreNMS is a fully featured network monitoring system. It has a lot of great features, and it supports many network device types and vendors such as Cisco, Juniper, Linux, Foundry etc.
You can manage, graph, and retrieve data as soon as you install the software. It will discover your network automatically.
It can do location-based mapping and bandwidth monitoring. It has network automation and server monitoring. It can be hosted locally on Linux (Ubuntu, CentOS etc), and it has an open API.
It has other features, such as bandwidth billing based on usage or transfer. It gets automatic updates, and it has an app for Android and IOS.
LibreNMS is free to use, and it can help you monitor your bandwidth easily.
7. Observium
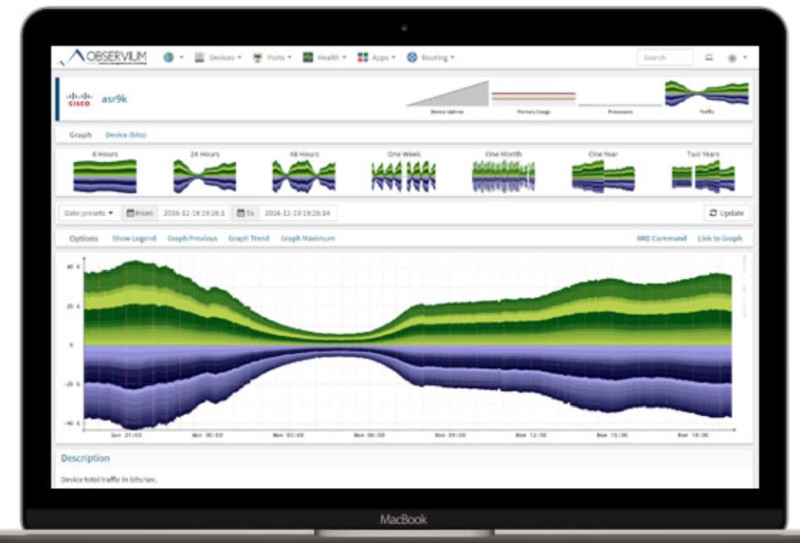
Observium is a network monitoring platform that supports a range of platforms, devices, and operating systems.
It uses a simple and intuitive interface to monitor your network. It is professionally developed and maintained by a team of network engineers and system administrators.
You can expand the visibility of your network because it automatically collects and displays information about it.
In addition, it will improve your network’s reliability by alerting you to issues before they impact your service.
It has a free version that is ideal for home labs, and there are two paid subscriptions, the Professional at $280 a year and the Enterprise at $1400 a year for large businesses.
It supports a number of devices and integrates with third-party applications.
8. Grafana
Grafana helps users with a general purpose dashboard and graphs. It allows them to see time series metrics, and it works with built-in integrations to analyze metrics.
It allows you to visualize data, monitor systems, and analyze what is happening. You can view charts, graphs, and alerts that let you know how your systems are functioning.
Grafana offers many different ways to visualize your data, and it sends you alerts while you are using it. It supports different data and brings them together in one dashboard.
It is completely open source, and it is backed up by a large community. It has many different dashboards and plugins in its library, and it offers collaboration opportunities.
9. MRTG
MRTG stands for Multi Router Traffic Grapher, and it can graph all kinds of data, including your network devices.
It monitors the traffic load on your network links, and it can generate HTML pages with PING images to show a live visual of the traffic.
It works on most UNIX platforms and Windows NT, and it is written in Perl and comes with full source code.
MRTG is free software and it’s licensed under the Gnu GPL. It identifies router interfaces by IP address, description, and Ethernet address in addition to the normal interface number.
Configuration and setup are simple and automatic. It can create visual representations of traffic that is seen during the past seven days, the past five weeks, and the past twelve months.
10. Solarwinds Real-Time Bandwidth Monitor
Solarwinds makes a real-time bandwidth monitor that is 100% free.
It lets you set critical and warning thresholds so that you can see when usage is having an issue. It tracks poll bandwidth usage in real time, you can monitor more than one interface at the same time, and you can view the bandwidth usage on an easy to read graph.
It offers a completely free version that has interface bandwidth polling and visual performance metrics.
They also have a paid version that is $1638, and it offers this and more, including network device discovery, availability and performance monitoring, network mapping, and more.
The paid subscription does offer a free 30-day trial so that you can see what it has to offer firsthand. You can run performance and availability reports, and it has network alerting.
Final Words
When you monitor your bandwidth, you will be able to optimize your network and also avoid bottlenecks and future problems.
These software tools all offer you different options to get graphs showing how your bandwidth is being used and who is using it.
Some of them are free and open source, and others offer one time fees for larger systems, and each one has a few features that are specific to it. You can choose the one that is ideal for your systems.
Note: The prices of the tools above are valid at the time of this writing.
Related Posts
- Beyond SNMP: API-Powered Monitoring for Cisco ACI Fabrics
- 15 Best Network IP Sniffing Software Tools (Free&Paid) – Wired and Wireless
- Automated Compliance for Network Devices using Network Configuration Management
- Beyond the Blips – The Importance of Network Traffic Analysis with the Right Tools
- The Role of Baseline Configuration Management in Network Configuration Management