Today, most data centers rely on policy-based automation and centralized control to manage increasingly dynamic workloads. Cisco’s Application Centric Infrastructure (ACI) delivers this flexibility by combining software-defined networking (SDN) with application intent, enabling rapid scaling without manual intervention.
However, monitoring Cisco ACI through SNMP alone fails to capture the complete operational picture of the network.
Traditional SNMP-based monitoring was designed for static device environments, not for programmable, multi-tenant fabrics that constantly reconfigure themselves.
A fabric that abstracts policies, endpoints, and tenants needs monitoring that can interpret its logical relationships – not just device metrics.
Understanding Cisco ACI fabric components
Cisco ACI consists of three key layers:
- Spine nodes: The backbone that interconnects all leaf switches, forming the high-speed fabric.
- Leaf nodes: The access layer connecting servers, firewalls, and other network endpoints.
- Application Policy Infrastructure Controller (APIC): The centralized control and management layer that defines, enforces, and monitors policies.
This architecture decouples configuration from hardware. Instead of managing VLANs or ACLs on each device, administrators define endpoint groups (EPGs) and bridge domains. The APIC then automatically programs the fabric.
While this approach simplifies deployment, it also changes how monitoring must be performed. Traditional device-based visibility is insufficient for understanding how policies, tenants, and endpoints interact across the fabric.
Why SNMP falls short in Cisco ACI environments
SNMP has been the standard for network monitoring for decades. It excels at collecting performance metrics such as interface traffic, errors, or CPU usage. However, the complexity of Cisco ACI requires monitoring beyond these metrics.
-
Static, interval-based data collection: SNMP polling runs at fixed intervals. Fast state changes, such as endpoint moves or policy updates, often go undetected.
-
Limited data model: SNMP lacks awareness of Cisco ACI constructs, including tenants and EPGs. It reports on devices, not relationships.
-
Scalability constraints: Large fabrics with hundreds of switches generate thousands of SNMP queries per minute, increasing management overhead.
-
No built-in context: SNMP data cannot correlate an interface issue with the application or tenant it affects.
-
Reactive insights: SNMP identifies that something failed, but rarely explains why or what else is impacted.
Cisco ACI environments demand monitoring that adapts as policies evolve and endpoints shift. This is where API-based data collection from the APIC becomes essential.
Benefits of API-based monitoring
The APIC provides a comprehensive set of RESTful APIs that expose configuration, operational, and health data for every managed object in the fabric.
These APIs enable real-time, structured access to the same data Cisco uses internally for assurance and troubleshooting.
Real-time state visibility
API calls return current operational data without waiting for polling intervals. As soon as a link changes state, or a tenant policy is updated, the APIC reflects the change immediately. This allows near-instant visibility and more accurate correlation with network events.
Unified fabric intelligence
All fabric objects – nodes, interfaces, EPGs, and bridge domains – are modeled within the APIC’s object store. Querying this hierarchy provides complete visibility across the physical and logical layers. This unified view eliminates the blind spots common in device-centric SNMP monitoring.
Event-driven fault reporting
The APIC continuously tracks configuration faults, hardware issues, and policy violations. Its fault database can be queried via APIs to identify the critical problems and their relationships to affected tenants or applications. Monitoring solutions can ingest this data for proactive alerting and RCA.
Contextual correlation
API responses include relationships between objects. For instance, when querying an endpoint, you can see which EPG and bridge domain it belongs to. This relationship data is vital for tracing the impact of a misconfiguration or device fault.
Lower resource consumption
Since API communication is event-driven, it avoids the overhead of continuous SNMP polling. A single APIC can represent the entire fabric, reducing query load while providing richer, more scalable insights.
Using APIs, and SNMP together for monitoring Cisco ACI networks
While APIs should form the backbone of Cisco ACI monitoring, combining multiple data sources delivers the most complete visibility:
- APIC APIs: For topology discovery, tenant and EPG health, and fault data.
- SNMP: For legacy or hardware-level metrics such as interface utilization, temperature, and system status.
Together, they build a multi-layered observability model that spans from fabric health to granular device telemetry.
Visualizing leaf-spine performance and tenant health
An effective Cisco ACI monitoring strategy must bridge physical and logical perspectives.
At the physical layer, metrics such as interface throughput, packet loss, and latency demonstrate how the spine-leaf topology performs under load. At the logical layer, monitoring must track EPGs and tenants, to ensure applications behave as intended.
Visualization tools can represent these relationships as:
- A topology map showing leaf-spine interconnections and real-time link status.
- Tenant dashboards summarizing application health and policy adherence.
- EPG-to-EPG communication heat maps to highlight blocked or degraded paths.
- Fault trees linking underlying device issues to affected application tiers.
By merging topology, performance, and policy data, network teams gain actionable visibility into how infrastructure behavior affects application delivery.
Proactive troubleshooting and fault correlation
API-based monitoring simplifies root cause analysis. Because the APIC understands dependencies across the fabric, it can help identify where and why failures occur.
For example:
- A downed spine link may degrade multiple EPG connections.
- A policy change might isolate a tenant’s workloads.
- A misconfigured contract could block legitimate inter-EPG communication.
By accessing APIC’s fault and event data, monitoring systems can pinpoint the source of the issue and identify which applications or tenants are impacted—reducing mean time to resolution significantly.
Best practices for Cisco ACI monitoring
Here are a few best practices to follow while monitoring Cisco ACI networks:
- Use APIC APIs as the primary data source for real-time operational data and health scores.
- Supplement with SNMP only where necessary for device-level performance metrics.
- Integrate syslog collection to capture audit trails and configuration changes.
- Leverage health scores and fault data to prioritize critical incidents.
- Automate correlation and remediation through event-driven workflows.
- Maintain configuration snapshots for drift detection and rollback validation.
Following these practices ensures visibility remains consistent even as the fabric scales or policies evolve.
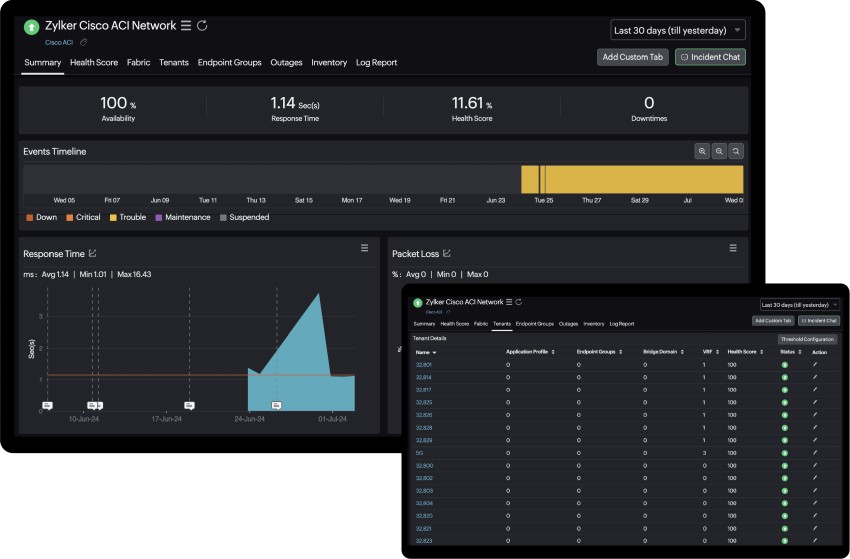
How Site24x7 monitors Cisco ACI fabrics
Site24x7 integrates directly with Cisco’s APIC APIs to collect real-time health and performance data from Cisco ACI fabrics. It automatically discovers leaf and spine nodes, tracks endpoint group communication, and aggregates tenant health metrics without the delays of SNMP polling. By combining API data with SNMP, it provides unified visibility across the physical and logical layers of the fabric.
With correlated dashboards and intelligent alerts, network teams can detect performance variations, and maintain fabric performance – ensuring reliable application delivery across complex Cisco ACI environments.
Related Posts
- 15 Best Network IP Sniffing Software Tools (Free&Paid) – Wired and Wireless
- Automated Compliance for Network Devices using Network Configuration Management
- Beyond the Blips – The Importance of Network Traffic Analysis with the Right Tools
- The Role of Baseline Configuration Management in Network Configuration Management
- Alternatives to VMware – Here are 7 Virtualization Solutions to Replace VMware