
Cisco is the sought-after vendor for solutions for most IT networking challenges, be it involving hardware, software, the cloud, or virtualization.
In 2022 alone, Cisco had a whopping 41% share in the network infrastructure vendor market, bigger than the combined share of the next six vendors on the list.
Cisco has an extensive offering of network gear, including network hardware, software-defined networks, wireless connectivity solutions, network security systems, and Internet of Things devices.
Cisco: Solutions for all networking challenges, but a challenge to monitor?
IT teams tasked with monitoring Cisco networks have quite a challenge cut out for them.
Cisco monitoring involves devices, interfaces, services, and applications across the network stack that need to be discovered and classified.
Once that’s done, you have to start monitoring: keep tabs on uptime, network performance, device health, and hardware, and ensure that SLA terms are honored.
Then there’s the task of tracking bandwidth usage, monitoring the performance of critical applications, backing up configurations, keeping logs, detecting rogue actors, and managing network security.
That’s a lot of work, and there’s little room for error. We’ve all heard the horror stories about broken BGP pushes that took down an entire nation’s network or someone accidentally turning off an uninterrupted power supply in a data center, resulting in a complete halt of services.
Alright, monitoring Cisco network infrastructure can be tough. What else is new?
When the stakes of unassuming mistakes are so high, it’s understandable to be a little paranoid.
You can set up ten-second monitoring intervals and prepare redundancies for every other router, and you can plan remedies for every imagined network nightmare, but that’s only going to eat up your budget and elevate the stress on your IT team.
So how do you monitor your networks effectively with your sanity and SLAs intact?
You do it by choosing the right network monitoring software. The right network monitoring software simplifies the jargon of IP addresses, network protocols, and network configurations and presents you with simple executable insights, like what went wrong, how it can be fixed, and how it can be prevented from happening again.
Network monitoring software: How to differentiate the pretenders from the real deal
Here are some questions you should consider when choosing network monitoring software to monitor your Cisco network infrastructure.
Does it support multiple network protocols?
Your network monitoring software should be able to leverage multiple protocols, like SNMP v1, v2 and v3; a CLI; LLDP; CDP; TCP; and ICMP.
This applies for most vendors and device types. Agent-based monitoring can also provide in-depth information about certain devices.
Generally, the more protocols the software supports, the more device types and vendors you’ll be able to monitor.
How easy is it to deploy and start monitoring?
The purpose of monitoring is defeated if the software you use has a steep learning curve.
Ideally, the software should be able to automatically discover, classify, and assign the right performance metrics for each device.
It’s also preferable to have some automation to manage things quickly in your absence.
Can it manage distributed networks from a central site?
Redundancy is the best insurance against downtime. Remote data centers are a great way of ensuring this.
However, if your monitoring tool can’t show you the health and status of your distributed infrastructure meaningfully, it’s only going to cause chaos and confusion.
Is it easy to keep track of network configurations?
A stable configuration to revert to is akin to a “get out of jail free card” for IT teams. If your monitoring tool has an option to manage configurations side-by-side with its monitoring, this helps with correlating network performance issues with outages.
For instance, if a bad configuration update causes an increase in dropped packets, you can easily refer to the tool and revert back to a stable configuration.
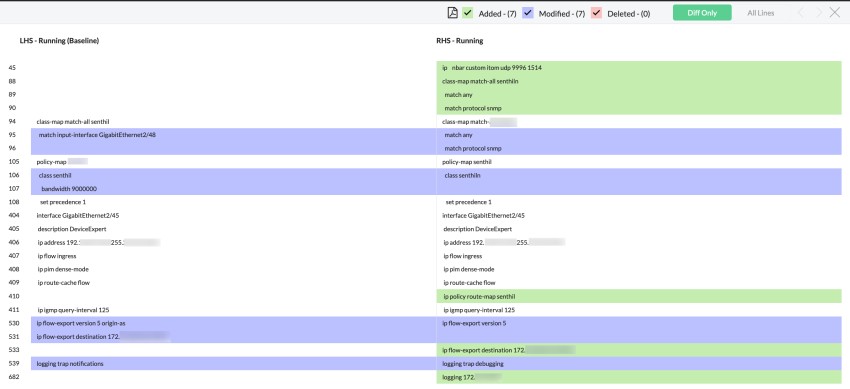
A difference view is a good way of reviewing configuration changes made on your Cisco routers. In the image above, changes between the running configuration and the stable baseline are compared.
Can it handle large data volumes without breaking?
Large data volumes don’t necessarily mean a large network. Even smaller network infrastructures can produce a flurry of information, especially if the monitoring requires very small intervals.
If your tool doesn’t have AI and ML features to ingest this data, remove false alarms and duplicates, and make correlations to give you the perfect amount of information to act on, you may get flooded with an unreasonably large number of alerts, which will do more harm than good.
Does it have mapping and reporting features?
Data visualization with maps and reports helps convey a lot of information efficiently. For instance, here are two ways of showing the status of Cisco switch ports in network monitoring software. Which one is easier to understand?
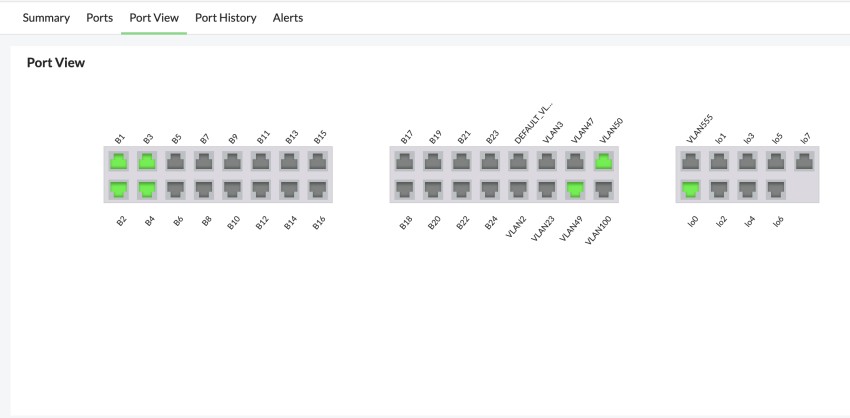
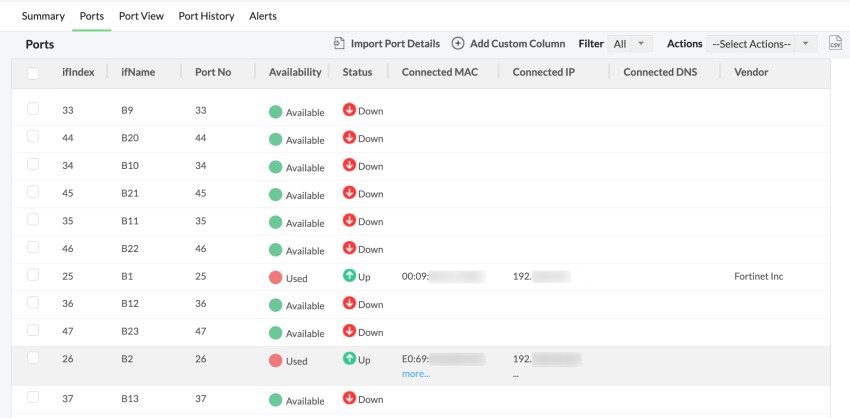
As you can see from above, the top image which shows a visual representation of the switch ports helps you gather a lot more information with a quick glance.
Monitoring Cisco network infrastructure: What metrics are most important?
Let’s take a look at some of Cisco’s network infrastructure offerings to understand what metrics to monitor. By focusing on critical metrics for each device, you can save valuable processing power and increase the efficiency of your Cisco monitoring software.
Monitoring network hardware:
For hardware devices like routers, switches, and firewalls, health monitoring is important.
This includes CPU metrics like CPU utilization, memory utilization, and buffer memory as well as hardware health metrics like voltage, temperature, and cooling.
Network traffic monitoring:
Device-specific, interface-specific, and application-specific traffic monitoring opens up new avenues to analyze and optimize bandwidth usage. Metrics like top talkers, and top bandwidth users also provide valuable insights.
Tracking network topology:
Protocols like CDP and LLDP allow you to monitor Cisco network topology. Monitoring network topology allows you to understand device dependencies, track down the root cause of outages, and plan maintenance.
Managing wireless networks:
For wireless network offerings, which include wireless LAN controllers (WLCs) and access points, signal strength is an important metric. Signal to noise ratio, or SNR, is another metric of interest. Tracking rogue SSIDs and access points is also be beneficial when monitoring rogue networks.
Cisco Meraki monitoring:
For Cisco Meraki installations, it’s important to keep track of the health of various devices as well as the traffic metrics. The ideal Cisco Meraki monitoring software should be able to provide quick updates on Meraki networks from multiple locations.
Cisco ACI monitoring:
Topology maps are particularly relevant for Cisco ACI as they help visualize the logical structure of the virtualized components. Like physical network hardware, you need to keep track of the health and performance of ACI network components.
Cisco IP SLA monitoring:
Cisco’s IP SLA feature enables IT teams to synthesize VoIP and WAN links between devices to proactively gather network performance insights. When monitoring an IP SLA link, SLA-specific metrics like round-trip time, packet loss, and jitter are critical.
How ManageEngine OpManager monitors Cisco networks: A quick walk-through
When it comes to Cisco network monitoring, OpManager can pretty much do it all, whether it concerns uptime, performance, hardware, or the CPU.
With dedicated off-the-shelf reports and dashboards for Cisco network hardware, WLCs, Cisco Meraki, Cisco ACI, and Cisco UCS, let’s see how OpManager fits the bill as the ideal Cisco monitoring software.
Discovery of Cisco devices:
OpManager’s auto-discovery can be scheduled to run at regular intervals. Whenever new devices are added to the network, OpManager automatically adds them to its inventory. If the right credentials are added, OpManager can also automatically assign relevant performance monitors and update the devices in already existing groups.
Network performance monitoring:
You can monitor network performance metrics like latency, packet loss, and traffic utilization, and get alerted when these values cross a threshold you set. OpManager also maps network topology using protocols like CDP, LLDP, FDB, and ARP to track topology changes effectively. You can also track VoIP and WAN performance with OpManager using Cisco’s IP SLA feature.
IT infrastructure monitoring:
For network hardware devices like routers and switches, you can assign CPU performance metrics like CPU utilization, memory usage, and buffer memory as well as hardware health monitoring for temperature, the cooling fan, and the power supply. Monitor wireless signal strength and SNR for WLCs and wireless access points, among other metrics.
Network configuration management (NCM):
With its NCM module, you can track configuration changes, monitor backups, find firmware vulnerabilities, and perform automatic change detection with OpManager. For each device, you can get alerts for backup status, perform side-by-side configuration change comparisons, and get updates about the latest vulnerabilities from the National Institute of Standards and Technology.
Monitoring distributed sites:
OpManager’s probe-central architecture can monitor large distributed sites with ease, gathering data from multiple probes into a central network operations center. OpManager also has customizable dashboards and CCTV views.
AI and ML and automation tools:
OpManager leverages powerful AI algorithms and an ML engine to ingest network data and assist you with monitoring.
For instance, OpManager’s adaptive thresholds calculate normal network activity on an hourly basis and automatically set alert thresholds for key metrics.
This reduces manual effort and false positives. Similarly, you can utilize OpManager’s AI tools to forecast network performance metrics.
Powerful reporting and visualizations:
OpManager features over 100 off-the shelf reports, including dedicated reports for Cisco Meraki, Cisco ACI, WLC devices, and Cisco network hardware.
OpManager also has automatic network topology maps, business visualizations, data center visualizations, and other powerful mapping features.
Talking the talk and walking the walk: Cisco network monitoring with OpManager
It’s always better to get a hands-on experience with software before buying it. Cisco network monitoring software is no different.
That’s why you can try a free, 30-day trial of OpManager first. You can also request a personalized demo to see if OpManager fits your specific requirements.
You can access OpManager’s free product trainings, help documentation, and pages to learn more about Cisco monitoring.
Related Posts
- Failure-Mode Engineering: Turning Network Adversity Into an Advantage
- What is Cisco Virtual Port Channel (vPC) – Explained and Discussed
- What is a Wildcard Mask – All About Wildcard Masks Used in Networking
- Configuration Drift? Not on our Watch in Networks
- What is Cisco Identity Services Engine (ISE)? Use Cases, How it is Used etc