The Paessler PRTG network monitoring solution is well known to network engineers and administrators. It conveniently monitors network activity including bandwidth usage, IP allocation, device status, network health, and even CPU utilization on networked devices (plus much more).
Paessler requires users to use a PRTG core server system running on Windows server OS (or two core servers for a failover cluster) in order to connect and keep tabs on other devices across a network.
Whether it’s due to the pricing structure, network device compatibility, OS preference, or another reason, many networking experts seek alternatives to this PRTG solution, and luckily, many do exist.
Just to be clear here, I don’t say that PRTG Network Monitor is a bad product or something.
It is actually a very reliable and effective network monitoring tool. However, some people want to investigate more options when it comes to their IT and network monitoring needs.
Read on to learn about some popular and solid PRTG alternatives for network monitoring and see which one would be most suitable for your network.
1. Auvik

Auvik is emerging as a trusted network management software company with several tools for keeping tabs on your network’s health and much more.
Their cloud-based network analysis and management tool can report on many of the same metrics that PRTG reports on, including uptime, device status, CPU and bandwidth utilization, network traffic anomalies and much more.
Much like PRTG, Auvik’s cloud management tools can be used as pre-configured or customized to monitor specific functions and flags on any network.
Auvik is currently deployed to manage and monitor more than 70,000 networks across the world and supports a wide range of networking devices such as Cisco, Meraki, Aruba, Fortinet, Juniper, Palo Alto, HP etc.
The way it works is the following:
You install a local Auvik collector on your network which can be a Windows service, a virtual appliance or a dedicated Linux box. The collector is responsible to securely send network monitoring information to the cloud Auvik service.
The collector will start scanning and identifying network devices on your network using various techniques such as nmap, SNMP, mDNS etc. This will create a map topology of your network.
From there on, you will have full visibility and management control of your local network from the Auvik cloud dashboard.
They offer a free trial so I recommend to try it now and see how it can help you with your monitoring and network management tasks.
2. OpManager
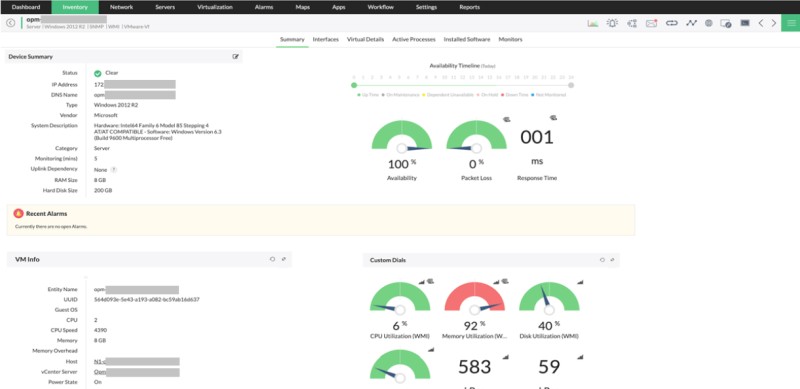
The OpManager tool from ManageEngine is a great PRTG alternative for those that need a deeper insight into their network hardware and performance.
This network analysis suite can track your network end-to-end, from your WAN links, wireless access points, physical and virtual servers, network devices such as routers, switches, firewalls and much more.
OpManager’s reporting is very granular with graphs and visual information displays that allow users to zoom in on specific areas of network usage and reports.
OpManager is positioned as a very good alternative to PRTG for network monitoring, offering cost-effectiveness and feature-rich solutions.
It has received positive reviews from customers and evaluations by third party vendors and has been recognized for its performance and functionality.
Regarding its licensing compared to PRTG, OpManager offers device-based licensing, while PRTG uses sensor-based licensing. This licensing scheme has the potential of better cost savings compared to PRTG in both shorterm and longterm.
They have three editions to choose from:
- Standard
- Professional
- Enterprise
Their mobile app for Android and iOS allows you to receive alarms and stay up-to-date with the availability and performance of your whole network and IT devices.
3. SolarWinds Network Performance Monitor
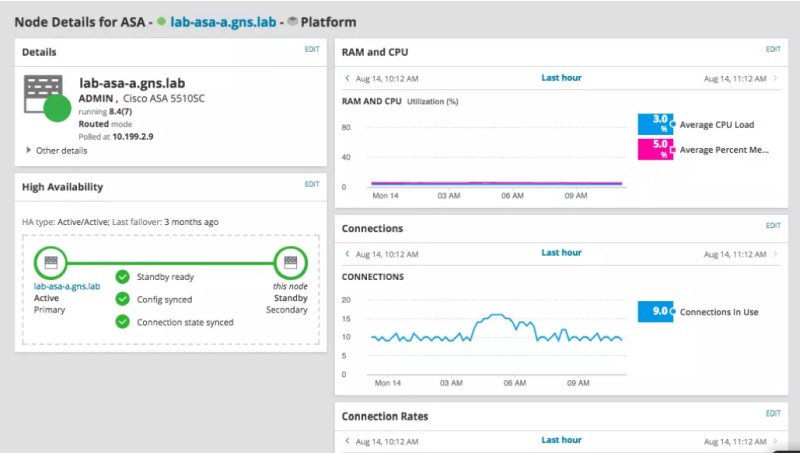
Another popular and comprehensive vendor in the network monitoring arena is SolarWinds.
The Network Performance Monitor (NPM) from SolarWinds is a great choice if you have a mixed device network consisting of hardware from a wide range of vendors.
It’s also broad ranging in its reporting tool, with an array of options for generating advanced metric reports on traffic patterns and anomalies.
One feature SolarWinds advertises heavily is the scalability of this software, which is helpful for growing companies or organizations in up-and-coming markets that may need to scale on short notice.
What I like about NPM is that you can even monitor your network’s VPN tunnels. For example, if you have Cisco ASA firewall devices with VPN tunnels terminated at them from external or remote networks and users, with NPM you can monitor and view the health of such VPN tunnels which are even more critical nowadays with employees working remotely etc.
4. Nagios XI
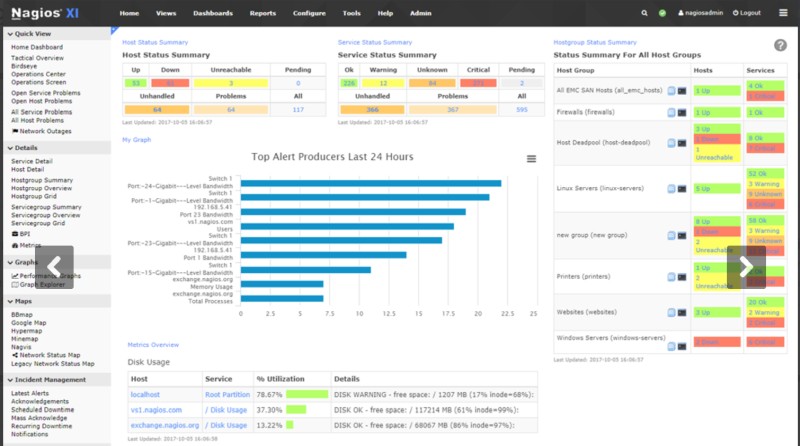
Nagios XI is an enterprise level alternative to PRTG that can monitor a virtually unlimited number of devices on any given network, and especially IT infrastructure devices.
It’s a great option for network and IT administrators who need custom reporting and interfaces, simplified graphs with executive summary style views, and planned decommissioning for pending device swaps.
You’ll also be able to schedule bulk host imports and batch modification tasks on your network with this comprehensive network management and IT monitoring tool.
Its pricing starts at $1,995 for the Standard Edition and at $3,495 for the Enterprise Edition.
The Nagios XI monitoring server can be installed on a local Linux machine running on Centos, RHEL, Ubuntu or Debian OS.
5. Zabbix
Zabbix is the preferred network monitoring tool for many expert administrators who know their way around because of its versatility and flexibility in monitoring about anything in your network.
Just like Nagios XI, Zabbix is focused more on IT infrastructure monitoring (Windows servers, Linux machines, cloud servers etc), but can also monitor any possible performance metrics and incidents in your network.
You can track your network either via the cloud or on a local server with this flexible solution.
Although Zabbix is an open source tool, it’s also an enterprise level software suite, making it ideal for larger organizations with hundreds or more devices including switches, routers, hubs, and endpoints.
Zabbix even has options to monitor at an application level, so you could easily, for example, track if any particular user or device is spending too much time streaming videos or browsing off-network.
This tool is very customizable with Templates and various custom configuration options, so it is a little hard to setup initially and has a steeper learning curve compared to other solutions.
6. LibreNMS
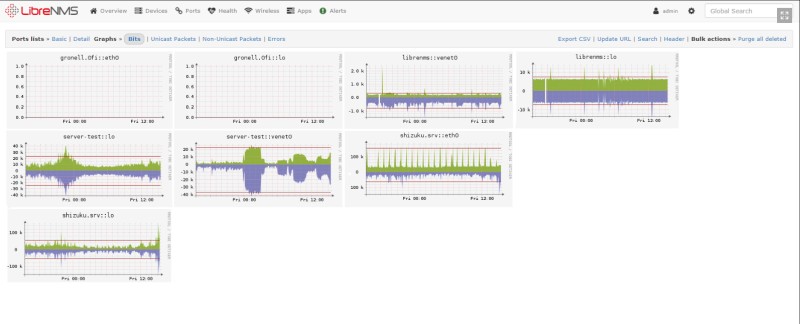
Another open-source and free tool in our list is LibreNMS. It is great for network devices monitoring (using SNMP) and Linux machines, but for monitoring Windows systems is lacking behind other options.
Network admins using LibreNMS enjoy its apps for both the iPhone and Android, that allow multiple designated employees to track network health and reports on the go.
This is also a great and free PRTG alternative for those who want to keep tabs on network analysis and monitoring such as bandwidth usage for billing purposes, as it contains tools to monitor and even calculate the cost of your network traffic.
LibreNMS also has API access for companies that wish to incorporate network metrics into reports and third-party tools.
7. Checkmk

Checkmk comes in two editions: The free and open source version (Raw Edition) and the commercial Enterprise Edition.
According to their marketing, there’s no network too complex for Checkmk to monitor.
Its advanced reporting tools can report on device and application level network statistics as well as cloud systems or even containers.
This, and the fact that it can also monitor a hybrid IT and network infrastructure environment, makes it a great option for those otherwise considering PRTG.
Those wanting to monitor databases as part of their network analysis can do so with Checkmk, as well as track Internet of Things (IoT) connectivity and performance, the latter being sometimes tricky with other network monitoring software.
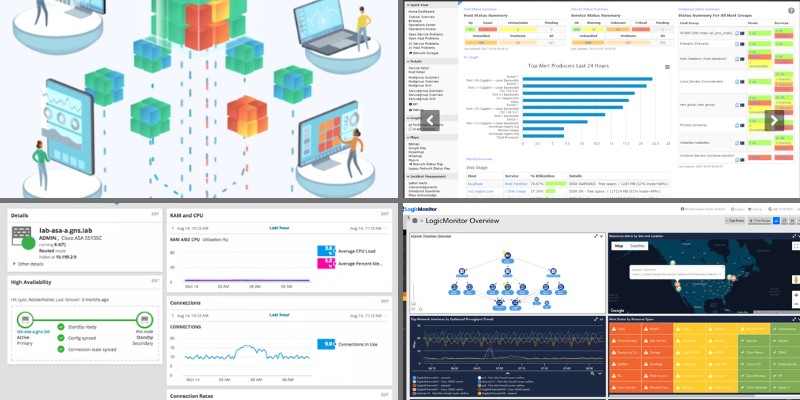
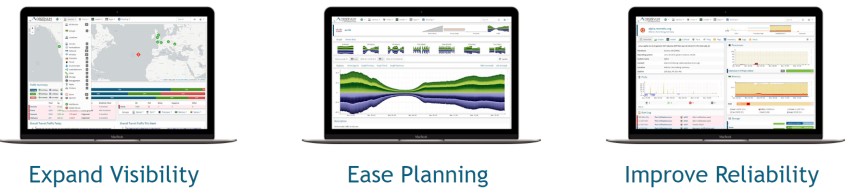
8. LogicMonitor
LogicMonitor, as its name implies, is all about automating logical processes for your network, including batch allocation, decommissioning, reporting, and threat management.
If you’re not looking to be overwhelmed with network alerts, consider using LogicMonitor to automatically identify and take action for the most important alerts with 90% less noise.
You can configure this tool to your liking, and of course you’ll still get actionable alerts as it comes out of the box, but you can reduce your alert noise and focus on the important tasks by letting this software take care of simple issues.
The categories covered by this tool include network monitoring, infrastructure and cloud monitoring, log analysis, server visibility etc.
The LM Envision tool is what is used for visualizing your entire network with autodiscovery of devices etc.
9. Observium
Observium is similar to LibreNMS (which is a fork of it) and comes in Enterprise, Professional and Community Editions, so you have a free version if you want to try it out. It is more a network centric tool instead of a systems monitoring tool.
This network analysis and monitoring tool works well with Windows, Cisco, HP, Juniper, and all major distributions on Linux that you’d find on an enterprise network.
Observium markets itself as tool built by network engineers to ease their own jobs and therefore is quite intuitive and practical.
Observium can watch for and often resolve network issues before they spread and impact other devices or create unwanted downtime on your network.
This is a great PRTG alternative for users wanting a cost-effective solution at any scale, since it has a free personal-use version, an accessible solution for professionals and small organizations, as well as an enterprise package for larger companies.
10. Pandora FMS
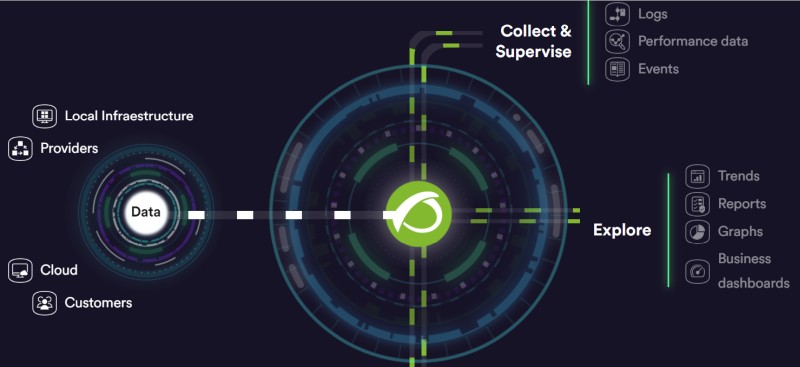
Pandora FMS prides itself on being one of the most flexible network and IT monitoring tools, and has been used by network engineers nearly as long as PRTG, coming onto the scene in 2004, just a year after PRTG’s initial release.
Pandora FMS allows users to observe and track trends across network usage, monitor alerts and service desk tasks, and store logs including Windows Event logs for troubleshooting and early issue identification.
Pandora FMS can even be configured to check applications for User Experience (UX) issues to detect potential problems before your clients or employees do.
It can be used either as an on-prem installation or as a SaaS product and its licensing is based on number of devices and can accommodate unlimited scalable infrastructures.
Related Posts
- Beyond SNMP: API-Powered Monitoring for Cisco ACI Fabrics
- 15 Best Network IP Sniffing Software Tools (Free&Paid) – Wired and Wireless
- Automated Compliance for Network Devices using Network Configuration Management
- Beyond the Blips – The Importance of Network Traffic Analysis with the Right Tools
- The Role of Baseline Configuration Management in Network Configuration Management